The power of infographics

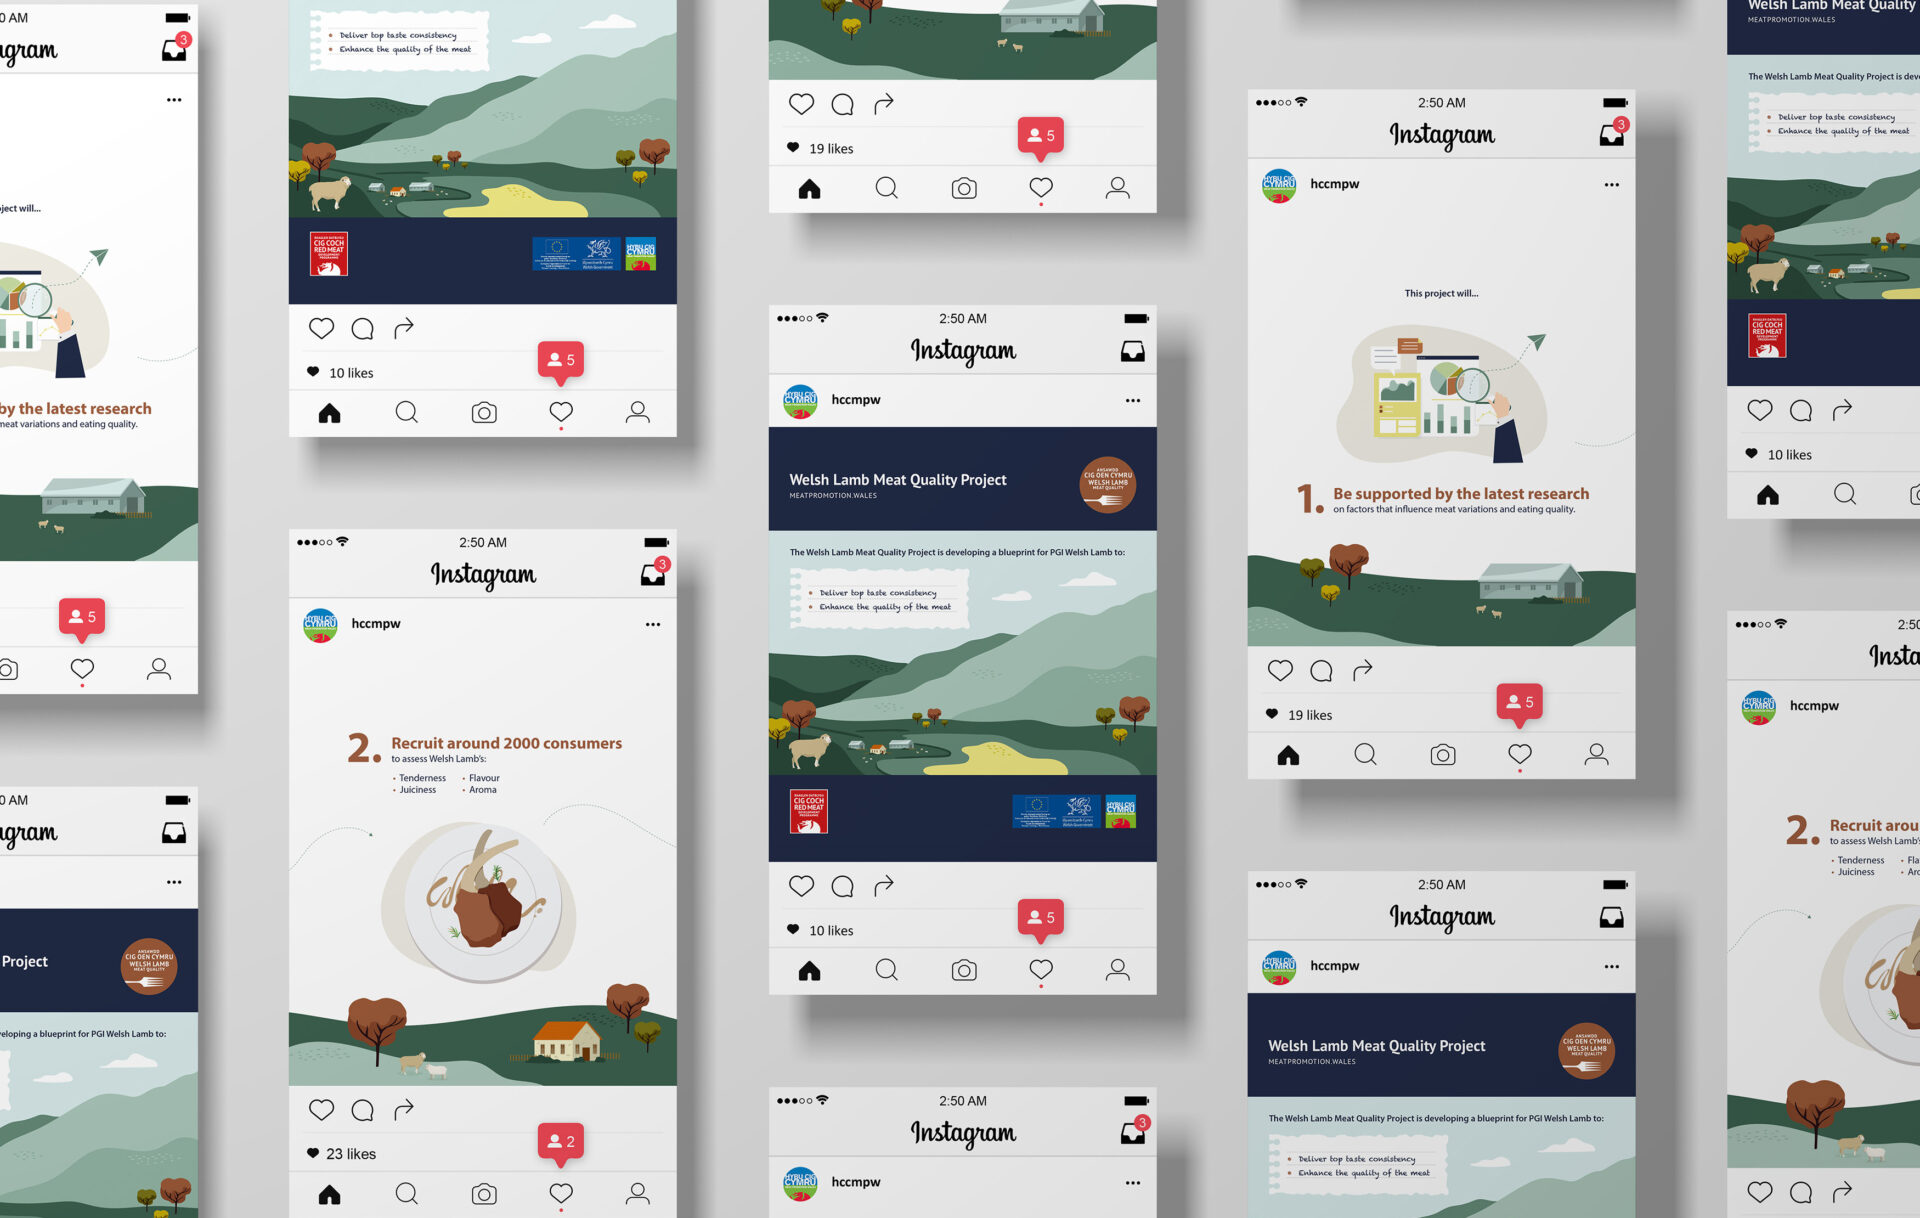
Infographics are powerful tools for visually communicating complex information in a simple and engaging manner. Utilising a mix of images, icons, and data visualisation techniques to convey concepts quickly and effectively, infographics offer a captivating way of conveying complex ideas with clarity and impact. By condensing information into digestible, visually appealing graphics, using infographics as a means of communication enhances comprehension and retention rates among audiences.

Here are our steps to creating effective infographics:

Define the message

Clearly defining the main message or key takeaway you want your audience to grasp is the starting point for an effective infographic.

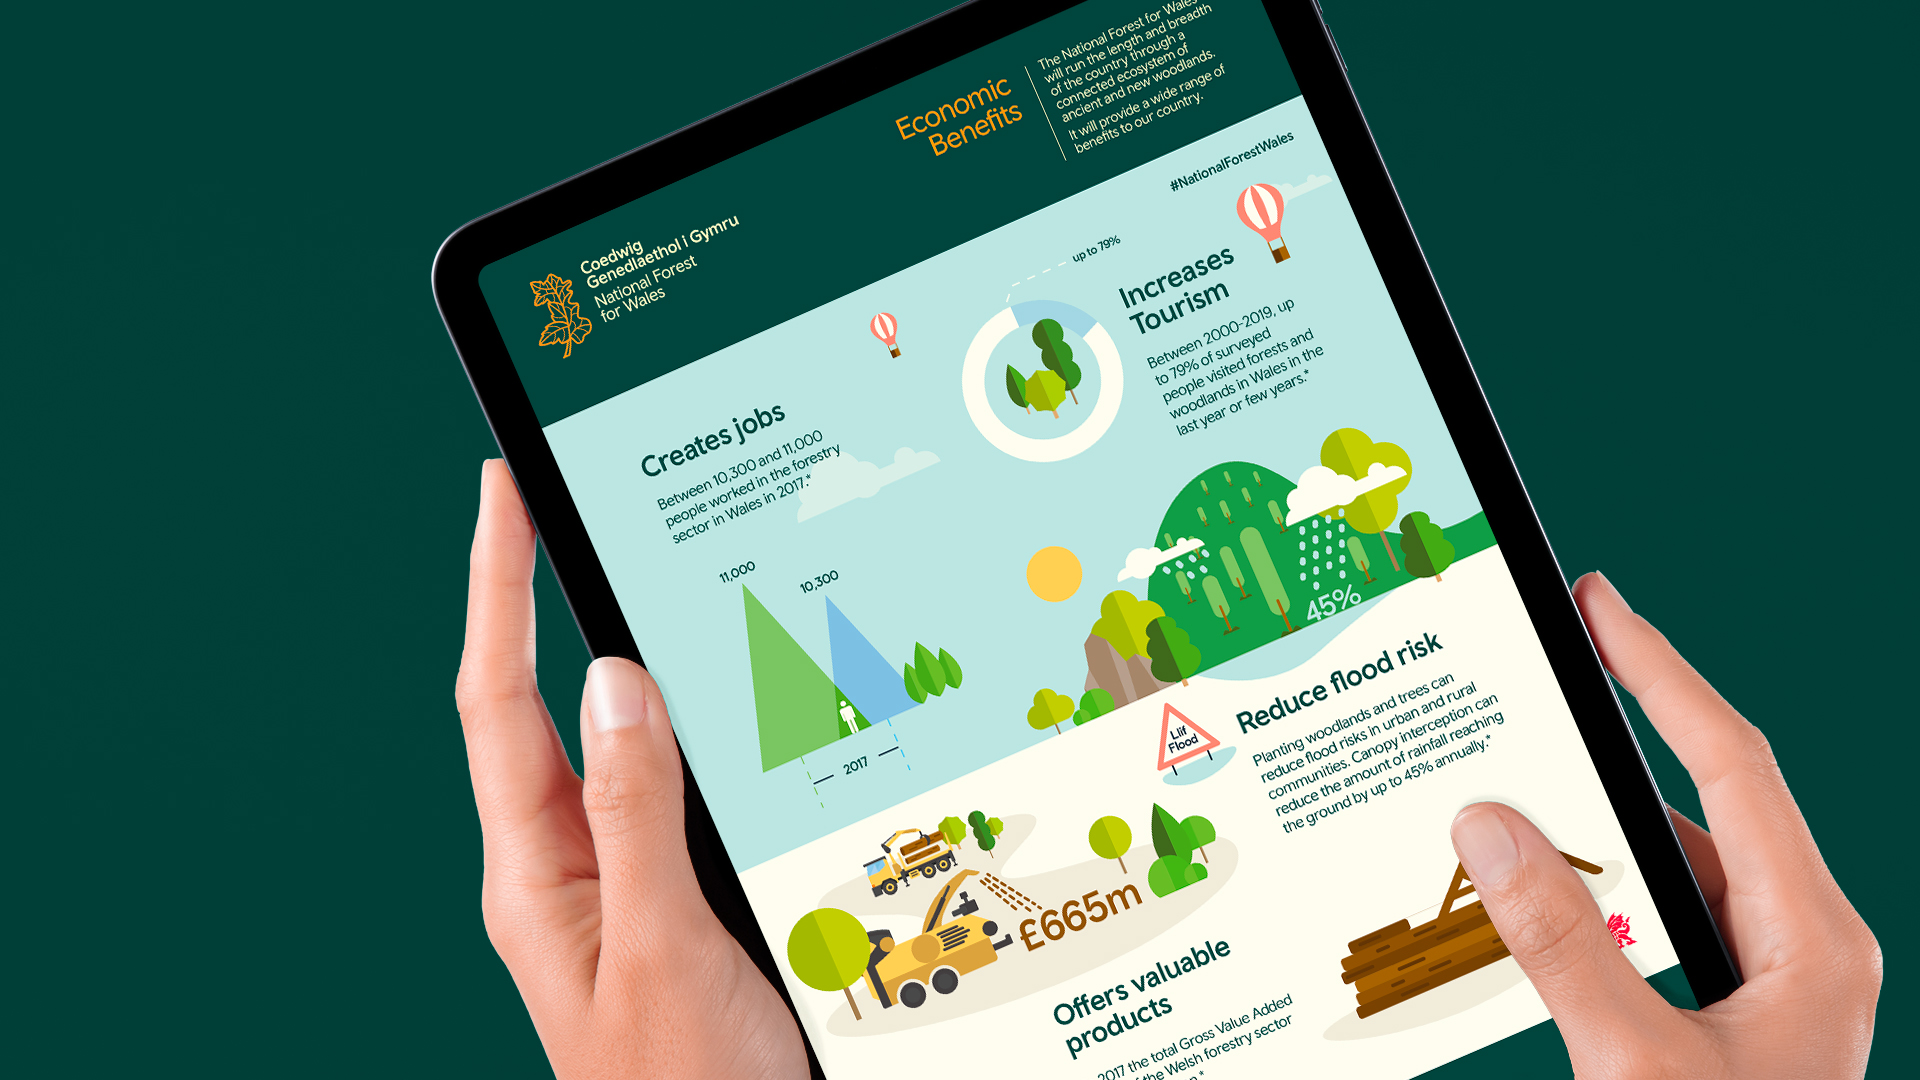
Simplify the information

Break down the complex information into smaller, digestible chunks, focussing on the most important points so as to avoid overwhelming your audience.

Use visual hierarchy

Arrange information in a way that guides the viewer’s eye through the content, using size, colour, and placement to emphasise key elements.

Flow and storytelling

Arrange information in a logical sequence or flow, guiding the viewer through a narrative.

Colour coding

Use a consistent colour scheme to categorise information or highlight important points, being mindful of colour contrast for readability.

Charts and graphs

Where appropriate, present data using charts and graphs to illustrate trends, comparisons, or relationships.

Typography

Be conscious of choosing clear and legible fonts and use different font sizes and styles to distinguish between headings, subheadings, and body text.

Consistent style

Maintain a consistent design style if you are creating a series of infographics to bring cohesion across all assets. This includes colour palette, fonts, and the overall visual theme.

Whitespace

Allow for ample whitespace to prevent clutter and improve readability. A well-balanced layout makes it easier for the audience to focus on the content.

Icons and symbols

Look to incorporate icons and symbols to represent concepts. This can make the information more intuitive and easier to understand.

Interactive elements

Where applicable, add interactive elements to allow audiences to actively participate in the exploration of data or information. This could include:

  • Clickable elements: Design elements such as icons, graphs, or sections that users can click on to reveal more information. This can include pop-up boxes, tooltips, or links to additional content.
  • Hover Effects: When a user hovers over specific elements, additional information or graphics appear. This can be useful for providing extra details without cluttering the main infographic.
  • Sliders and Filters: Allow users to manipulate data sets or change the focus of the infographic dynamically. For example, adjusting a slider to view data over different time periods.
  • Interactive Maps: Allow users to explore geographical data by clicking on regions or using zoom and pan features. The map could display additional details or statistics for the selected area.
  • Progressive disclosure: Instead of presenting all information at once, we can use interactive elements to progressively disclose details as the user navigates through the infographic. This can maintain user engagement and prevent overwhelming them with information.
  • Clickable Pathways: Creating a guided pathway through the infographic, where users can click on specific choices or options to customise their journey and explore the content in a nonlinear manner.

If you’re looking to transform your data or ideas into captivating visual stories, get in touch. Our designers specialise in crafting engaging infographics that will resonate with your audiences. Contact us today to discuss your needs and let us help bring your ideas to life.